Alstom 2018/19 results
Alstom 2018/19 results
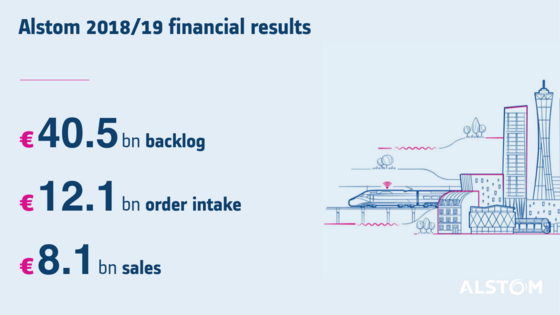
- Outstanding level of order intake at €12.1 billion, leading to a new record-breaking backlog of €40.5 billion
- Strong operational performance with sales at €8.1 billion (10% growth) and adjusted EBIT margin of 7.1%
- Proposed dividend of €5.50 per share
7 May 2019 – Between 1 April 2018 and 31 March 2019, Alstom booked €12.1 billion of orders. Over the same period, sales reached €8.1 billion, corresponding to growth of 10% (11% organically). The adjusted EBIT increased to €570 million, 44% above last year, leading to an adjusted EBIT margin of 7.1%. Net income (Group share) amounted to €681 million, compared to €365 million the previous year, including exceptional net income from discontinued operations of €248 million.
Alstom benefits from a very strong balance sheet. During fiscal year 2018/19, free cash flow amounted to €153 million. Net cash, including the sales of interests in the three Energy Joint Ventures to General Electric, amounted to €2,325 million on 31 March 2019. Equity amounted to €4.2 billion at 31 March 2019.
At its next Shareholders’ Meeting planned on 10 July 2019, Alstom will propose a dividend of €5.50 per share.
Key figures
|
(in € million) |
2017/18* |
2018/19 |
% change reported |
% change organic |
||
Actual figures |
|
|
|
|
|
|
|
Orders backlog |
35,239 |
40,481 |
15% |
13% |
|
|
|
Orders received |
7,183 |
12,107 |
69% |
71% |
|
|
|
Sales |
7,346 |
8,072 |
10% |
11% |
|
|
|
Adjusted EBIT |
397 |
570 |
44% |
|
|
|
|
Adjusted EBIT margin |
5.4% |
7.1% |
|
|
|
|
|
Net income - Group share |
365 |
681 |
|
|
|
|
|
Free cash flow |
128 |
153 |
|
|
|
|
|
Net cash / (debt) |
(255) |
2,325 |
|
|
|
|
|
Equity |
3,430 |
4,159 |
|
|
|
|
* Restated IFRS 9 & 15
" Alstom benefited from an exceptional commercial momentum this year with a record level of order intake at €12 billion, including two major contracts with the renewal of the very high-speed train fleet in France and the metro system project for Montreal. The very strong sales growth and the further margin enhancement confirm the success of our 2020 strategy, which is now completed. " said Henri Poupart-Lafarge, Alstom Chairman and Chief Executive Officer.
***
Success of the 2020 strategy and 2018/19 performance
Alstom 2020 strategy is based on the five following pillars:
1 - Customer-focused organisation
The Group booked €12,107 million orders in the fiscal year 2018/19. This compares to €7,183 million over the same period last year.
Alstom was awarded projects in all regions, including an order for 100 next-generation very high speed trains in France, a driverless regional express train for Montreal, a metro maintenance contract for Riyadh, metro cars for the Grand Paris Express in France, regional trains in Luxembourg, trains and maintenance in Italy, a major rolling stock contract for Mumbai, an integrated metro system for Taipei, a long-term rolling stock and signalling maintenance contract for Sydney metro, a national on-board train control system in Norway, electric locomotives in Morocco and Citadis trams for Frankfurt. External orders for signalling were high at €1.5 bn representing a book to bill of 1.2. At €40.5 billion on 31 March 2019, current backlog provides strong visibility on future sales.
2 - Complete range of solutions
In fiscal year 2018/19, Alstom’s total sales reached €8,072 million, up 10% (11% organically).
Signalling, systems and services represented 57% of sales in 2018/19. Systems sales increased by around 16% with the progress of urban systems projects in the Middle East and Panama metro in Latin America. Services sales reached €1.6 billion, with notably the contribution of long-term contracts in the United Kingdom and Italy. Signalling sales amounted to €1.3 billion, with lower activity in the United Kingdom and Brazil. Rolling stock sales reached €3.4 billion with deliveries of regional and high-speed trains in Europe and the ramp-up of the Amtrak project in the USA.
3 - Value creation through innovation
Alstom sustained its level of research and development (gross costs) at €380 million, i.e. 4.7% of sales, in fiscal year 2018/19. Main programmes included the renewal of rolling stock ranges, execution of signalling R&D and the investment in Digital solutions. In September 2018, Alstom’s hydrogen trains Coradia iLint entered passenger service in Lower Saxony, a world premiere. In March 2019, Alstom also opened StationOne, the first online marketplace dedicated to the railway sector. Finally, the APTIS electric bus won its first contract in Strasbourg, France.
4 - Operational and environmental excellence
Alstom delivered an adjusted EBIT of €570 million in 2018/19, compared to €397 million the previous year, representing a 44% increase. The adjusted EBIT margin reached 7.1% for the fiscal year 2018/19, compared to 5.4% for the fiscal year 2017/18. This continued improvement was driven by volume increase, efficiencies in operational performance and a contained cost structure. During the fiscal year 2018/19, net income (Group share) amounted to €681 million, compared to €365 million the previous year, including exceptional net income from discontinued operations of €248 million linked to the transaction with General Electric.
In terms of environmental excellence, energy consumption is to be reduced by 20% for solutions and by 10% for operations by 2020. With the objective of constantly improving safety at work, the Group targets an occupational injury frequency rate[1] of 1 by 2020. Alstom has already reduced its energy consumption by 17% for solutions, by 13% for operation and this year reached its occupational injury frequency rate1 target of 1.1.
Alstom improved its score in the Dow Jones Sustainability World and Europe indexes in 2018 with an overall score of 81 out of 100 in the DJSI ranking, which represents a one-point improvement compared to previous year. Alstom scored A- at CDP’s 2018 climate change questionnaire.
5 - Diverse and entrepreneurial people
To reflect Alstom’s passenger base, the company has the ambition to increase diversity, aiming for 25% of Management or Professional roles to be occupied by women in 2020. In 2018/19, this indicator reached 21%.
Alstom’s employees around the world all share the same culture, underpinned by strong integrity and ethics values. In June 2017, Alstom obtained ISO 37001 certification for its anti-bribery management system, confirming its commitment to fight corruption. Alstom also announced that the three-year period of self-reporting obligations that the Group agreed to as part of the Plea Agreement of 22 December 2014 has come to a successful completion. This achievement is the result of the company’s efforts during the period and a close cooperation with the US Department of Justice. The company remains committed to the highest level of integrity in its activities and will continue the development of its compliance programme.
***
Solid balance sheet
During fiscal year 2018/19, the Group free cash flow was positive at €153 million, benefitting from positive EBIT evolution and impacted by phasing of transformation capex, working capital driven by ramp-up of major projects signed in previous years, as well as Siemens/Alstom deal costs impact.
Alstom invested €207 million in capital expenditures in fiscal year 2018/19, compared to €203 million the previous year. As end of March 2019, the cumulated transformation capex stood at €269 million, out of €300 million, with notably the progress in sites’ construction in South Africa and in India.
The Group had a gross cash in hand of €3,432 million at the end of March 2019 and a fully undrawn credit line of €400 million. After reimbursement at maturity of a €371 million bond in October 2018, Alstom bond debt amounted to €878 million as end of March 2019. Alstom net cash included the sale of interests in the three Energy Joint Ventures to General Electric amounting to €2,325 million on 31 March 2019. Last, equity reached €4,159 million at 31 March 2019, versus €3,430 million at 31 March 2018.
***
Dividend
The Board of Directors decided to propose a dividend of €5.50 per share to the Shareholder’s Meeting that will be held on 10 July 2019, given net cash position at 31 March 2019, positively impacted by the sales of interests of the three Energy Joint Ventures to General Electric for €2,594 million.
The ex-dividend date would be 15 July 2019 and the record date would be 16 July 2019. The dividend would be payable in cash from 17 July 2019.
***
Outlook
The Alstom outlook will be provided during a Capital Markets Day to be hosted in Paris on 24 June 2019.
The management report and the consolidated financial statements, as approved by the Board of Directors, in its meeting held on 6 May 2019, are available on Alstom’s website at www.alstom.com. The accounts have been audited and certified.
In accordance with AFEP-MEDEF recommendations, information related to the remuneration of Alstom‘s Executive Officer is available on Alstom’s website: www.alstom.com, under About us/Corporate Governance/Compensation of Executive Officers.
This press release contains forward-looking statements which are based on current plans and forecasts of Alstom’s management. Such forward-looking statements are relevant to the current scope of activity and are by their nature subject to a number of important risks and uncertainty factors (such as those described in the documents filed by Alstom with the French AMF) that could cause actual results to differ from the plans, objectives and expectations expressed in such forward-looking statements. These such forward-looking statements speak only as of the date on which they are made, and Alstom undertakes no obligation to update or revise any of them, whether as a result of new information, future events or otherwise.
Appendix 1a – Geographic Breakdown
|
Actual figures |
FY 2017/18 |
% |
FY 2017/18 |
% |
FY 2018/19 |
% |
|
(in € million) |
(published) |
Contrib. |
(rest. IFRS 9 & 15) |
Contrib. |
|
Contrib. |
|
Europe |
3,507 |
48% |
3,507 |
48% |
7,337 |
60% |
|
Americas |
1,628 |
23% |
1,628 |
23% |
2,155 |
18% |
|
Asia / Pacific |
980 |
14% |
980 |
14% |
1,429 |
12% |
|
Middle East / Africa |
1,068 |
15% |
1,068 |
15% |
1,186 |
10% |
|
Orders by destination |
7,183 |
100% |
7,183 |
100% |
12,107 |
100% |
|
Actual figures |
FY 2017/18 |
% |
FY 2017/18 |
% |
FY 2018/19 |
% |
|
(in € million) |
(published) |
Contrib. |
(rest. IFRS 9 & 15) |
Contrib. |
|
Contrib. |
|
Europe |
3,938 |
50% |
3,749 |
51% |
4,061 |
51% |
|
Americas |
1,531 |
19% |
1,333 |
18% |
1,470 |
18% |
|
Asia / Pacific |
974 |
12% |
900 |
12% |
921 |
11% |
|
Middle East / Africa |
1,508 |
19% |
1,364 |
19% |
1,620 |
20% |
|
Sales by destination |
7,951 |
100% |
7,346 |
100% |
8,072 |
100% |
Appendix 1b – Product Breakdown
|
Actual figures |
FY 2017/18 |
% |
FY 2017/18 |
% |
FY 2018/19 |
% |
|
(in € million) |
(published) |
Contrib. |
(rest. IFRS 9 & 15) |
Contrib. |
|
Contrib. |
|
Rolling stock |
3,189 |
45% |
3,189 |
45% |
6,078 |
50% |
|
Services |
2,180 |
30% |
2,180 |
30% |
3,144 |
26% |
|
Systems |
523 |
7% |
523 |
7% |
1,359 |
11% |
|
Signalling |
1,291 |
18% |
1,291 |
18% |
1,526 |
13% |
|
Orders by destination |
7,183 |
100% |
7,183 |
100% |
12,107 |
100% |
|
Actual figures |
FY 2017/18 |
% |
FY 2017/18 |
% |
FY 2018/19 |
% |
|
(in € million) |
(published) |
Contrib. |
(rest. IFRS 9 & 15) |
Contrib. |
|
Contrib. |
|
Rolling stock |
3,464 |
43% |
3,150 |
43% |
3,448 |
43% |
|
Services |
1,480 |
19% |
1,354 |
18% |
1,556 |
19% |
|
Systems |
1,691 |
21% |
1,527 |
21% |
1,766 |
22% |
|
Signalling |
1,316 |
17% |
1,315 |
18% |
1,302 |
16% |
|
Sales by destination |
7,951 |
100% |
7,346 |
100% |
8,072 |
100% |
Appendix 2 – Income statement
|
Actual figures |
FY 2017/18 |
FY 2017/18 |
FY 2018/19 |
|
(in € million) |
(published) |
(rest. IFRS 9 & 15) |
|
|
Sales |
7,951 |
7,346 |
8,072 |
|
Adjusted Earnings Before Interest and Taxes (aEBIT) |
514 |
397 |
570 |
|
Restructuring charges |
(47) |
(47) |
(65) |
|
Other charges |
(86) |
(86) |
(97) |
|
Earnings Before Interest and Taxes (EBIT) |
381 |
264 |
408 |
|
Financial result |
(91) |
(99) |
(88) |
|
Tax result |
(73) |
(59) |
(70) |
|
Share in net income of equity investees |
216 |
216 |
195 |
|
Minority interests from continued operations |
(10) |
(9) |
(12) |
|
Net income – Discontinued operations* |
52 |
52 |
248 |
|
Net income – Group share |
475 |
365 |
681 |
*Group share
Appendix 3 – Free cash flow
|
Actual figures |
FY 2017/18 |
FY 2018/19 |
|
(in € million) |
(rest. IFRS 9 & 15) |
|
|
EBIT |
264 |
408 |
|
Depreciation and amortisation |
168 |
194 |
|
Capital expenditure |
(203) |
(207) |
|
R&D capitalisation |
(90) |
(68) |
|
Change in working capital |
91 |
(12) |
|
Financial cash-out |
(66) |
(90) |
|
Tax cash-out |
(93) |
(105) |
|
Other |
57 |
33 |
|
Free cash flow |
128 |
153 |
Appendix 4 - Non-GAAP financial indicators definitions
This section presents financial indicators used by the Group that are not defined by accounting standard setters.
Orders received
A new order is recognised as an order received only when the contract creates enforceable obligations between the Group and its customer.
When this condition is met, the order is recognised at the contract value.
If the contract is denominated in a currency other than the functional currency of the reporting unit, the Group requires the immediate elimination of currency exposure through the use of forward currency sales. Orders are then measured using the spot rate at inception of hedging instruments.
Order backlog
Order backlog represents sales not yet recognised on orders already received.
Order backlog at the end of a financial year is computed as follows:
- order backlog at the beginning of the year;
- plus new orders received during the year;
- less cancellations of orders recorded during the year;
- less sales recognised during the year.
Order backlog corresponds to the transaction price allocated to the remaining performance obligations, as per IFRS15 standard quantitative and qualitative disclosures requirements.
Book-to-Bill
The book-to-bill ratio is the ratio of orders received to the amount of sales traded for a specific period.
Adjusted EBIT
When Alstom’s new organisation was implemented, adjusted EBIT (“aEBIT”) became the key performance indicator to present the level of recurring operational performance. This indicator is also aligned with market practice and comparable to direct competitors.
aEBIT corresponds to Earning Before Interests and Tax adjusted for the following elements:
- net restructuring expenses (including rationalisation costs);
- tangibles and intangibles impairment;
- capital gains or loss/revaluation on investments disposals or controls changes of an entity;
- and any other non-recurring items, such as some costs incurred to realise business combinations and amortisation of an asset exclusively valued in the context of business combination as well as litigation costs that have arisen outside the ordinary course of business.
A non-recurring item is a “one-off” exceptional item that is not supposed to be reappearing in following years and that is significant.
Adjusted EBIT margin corresponds to Adjusted EBIT in percentage of sales.
The non-GAAP measure adjusted EBIT indicator reconciles with the GAAP measure EBIT as follows:
|
|
Year ended |
Year ended |
|
(in € million) |
31 March 2018 (rest. IFRS 9 & 15) |
31 March 2019 |
|
Adjusted Earnings Before Interest and Taxes (aEBIT) |
397 |
570 |
|
Restructuring costs |
(47) |
(65) |
|
PPA amortisation and integration costs |
(25) |
(15) |
|
Siemens deal costs |
(39) |
(74) |
|
Others and asset impairment |
(22) |
(8) |
|
Earnings Before Interest and Taxes (EBIT) |
264 |
408 |
Free cash flow
Free cash flow is defined as net cash provided by operating activities less capital expenditures including capitalised development costs, net of proceeds from disposals of tangible and intangible assets. In particular, free cash flow does not include the proceeds from disposals of activity.
The most directly comparable financial measure to free cash flow calculated and presented in accordance with IFRS is net cash provided by operating activities.
A reconciliation of free cash flow and net cash provided by operating activities is presented below:
|
|
Year ended |
Year ended |
|
(in € million) |
31 March 2018 (rest. IFRS 9 & 15) |
31 March 2019 |
|
Net cash provided by / (used in) operating activities |
418 |
425 |
|
Capital expenditure (including capitalised R&D costs) |
(293) |
(275) |
|
Proceeds from disposals of tangible and intangible assets |
3 |
2 |
|
Free cash flow |
128 |
153 |
Alstom uses the free cash flow both for internal analysis purposes as well as for external communication as the Group believes it provides accurate insight regarding the actual amount of cash generated or used by operations.
Net cash/(debt)
The net cash/(debt) is defined as cash and cash equivalents, other current financial assets and non-current financial assets directly associated to liabilities included in financial debt, less financial debt.
|
|
Year ended |
Year ended |
|
(in € million) |
31 March 2018 |
31 March 2019 |
|
Cash and cash equivalents |
1,231 |
3,432 |
|
Other current financial assets |
8 |
10 |
|
Financial non-current assets directly associated to financial debt |
213 |
201 |
|
Less: |
|
|
|
Current financial debt |
543 |
1,032 |
|
Non-current financial debt |
1,164 |
286 |
|
Net cash/(debt) at the end of the period |
(255) |
2,325 |
Organic basis
Figures given on an organic basis eliminate the impact of changes in scope of consolidation and changes resulting from the translation of the accounts into Euro following the variation of foreign currencies against the Euro. The Group uses figures prepared on an organic basis both for internal analysis and for external communication, as it believes they provide means to analyse and explain variations from one period to another. However these figures are not measurements of performance under IFRS.
|
Year ended 31 March 2018 (rest. IFRS 9 & 15) |
Year ended 31 March 2019 |
|
|
|
|||||||
|
(in € million) |
Actual |
Exchange |
Scope |
Comparable |
Actual |
Scope |
Comparable |
|
% Var Act. |
% Var Org. |
|
|
Backlog |
35,239 |
(56) |
- |
35,183 |
|
40,481 |
(623) |
39,858 |
|
15% |
13% |
|
Orders |
7,183 |
(83) |
- |
7,101 |
|
12,107 |
- |
12,107 |
|
69% |
71% |
|
Sales |
7,346 |
(44) |
- |
7,302 |
|
8,072 |
- |
8,072 |
|
10% |
11% |
[1] Number of work-related injuries which prevent the injured person from carrying out work for a period of at least one full day per million of hours worked