Alstom Q1 2019/20 Orders and Sales
Alstom Q1 2019/20 Orders and Sales

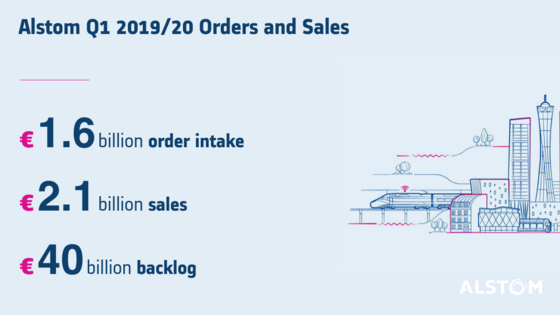
- Level of orders intake of €1.6 billion
- Sales level at €2.1 billion, up 2%
- Outlook confirmed
18 July 2019 – Over the first quarter of fiscal year 2019/20 (from 1 April to 30 June 2019), Alstom booked €1.6 billion of orders, compared to €2.6 billion over the same period last year. The Group’s sales increased to €2.1 billion, up 2% (+1% organic) compared to €2.0 billion over the first quarter of 2018/19.
At €40 billion on 30 June 2019, the current backlog provides strong visibility on future sales.
Key figures
|
Actual figures (in € million) |
2018/19 Q1 |
2019/20 Q1 |
% change reported |
% change organic |
||
|
|
|
|
|
|
|
|
|
Orders received |
2,641 |
1,620 |
(39)% |
(39)% |
|
|
|
Sales |
2,017 |
2,054 |
2% |
1% |
|
|
Geographic and product breakdowns of reported orders and sales are provided in Appendix 1. All figures mentioned in this release are unaudited.
“During this first quarter, we won several key orders related with our latest innovations: the ebus Aptis and the Coradia iLint, the world’s first hydrogen train. We also successfully delivered two important projects: the first Coradia Stream “Pop” train in Italy and the Sydney North West Metro. This demonstrates the strengths of Alstom in terms of smart and green innovation as well as efficient delivery, two pillars of our newly launched Alstom in Motion Strategic plan.” said Henri Poupart-Lafarge, Alstom Chairman and Chief Executive Officer.
***
Detailed review
During the first quarter of 2019/20, Alstom recorded €1.6 billion of orders, with a large Rolling stock orders intake in Europe, notably in Germany with a major contract of Coradia iLint trains for the Hessen region and for the Hamburg metro, in France with Coradia Polyvalent trains, and in both Netherlands and Italy with additional Coradia Stream trains. The group was also awarded Signalling contracts in Europe and Asia-Pacific. The Q1 2019/20 order book compares to last year’s Q1 orders of €2.6bn which included the large contract for the Montreal driverless light metro system.
Sales, at €2.1 billion, were up 2% (+1% organic) in the first quarter 2019/20, compared to the same period last year, with a decrease in Systems balanced by a notable growth in Signalling and Rolling stock. Sales were mainly fuelled by system projects in the Middle East, rolling stock contracts in Europe mainly with the Coradia product family delivering sales in France, Germany, Italy and the Netherlands and the Amtrak contract in the US.
Main events
In May 2019, the Sydney North West Metro line delivered by Alstom entered into commercial service. It represents Australia’s biggest public transport project and the first fully automated metro project in the country, with one million commuters travelling the line within two weeks.
In June 2019, the first three regional Coradia Stream “Pop” trains, out of a total of 47 trains destined for Emilia Romagna, entered into passenger services.
Alstom confirms the development of innovative products and its commitment towards more sustainable solutions with several orders over the quarter for Aptis ebuses in Paris, Grenoble and La Rochelle and a major order of Hydrogen Coradia iLint trains with RMV in Germany for the renewal of diesel trains.
In June 2019, after becoming the first French company to obtain the AFAQ ISO 37001 Anti-bribery certification for France and Europe in 2017, followed by Asia-Pacific in 2018, Alstom has obtained certification for its countries of operation in the regions of North America, Middle-East & Africa and Latin America.
Alstom hosted on 24 June 2019 in Paris a Capital Markets Day for financial analysts and investors. During this event, Alstom presented its new strategic plan – AiM Alstom in Motion, as well as new financial objectives until 2023.
Outlook
The Alstom outlook is provided at constant perimeter and exchange rates. It is set in accordance with the IFRS 15 and 16 norms.
The 2019/20 fiscal year will be a year of stabilisation of growth after a 2018/19 fiscal year with an exceptional sales and profitability growth. For 2019/20 fiscal year, the business cycle with the finalisation of major systems contracts and the evolution of large Rolling stock projects will lead to a sales and margin growth lower than the average objectives set in the context of AiM, and to a working capital evolution impacting the generation of free cash flow.
Up to March 2023, Alstom targets an average annual growth rate of sales around 5% over the period 2019/20 – 2022/23, an adjusted EBIT margin[1] to reach around 9% in 2022/23, a conversion from net income[2] to free cash flow above 80% by 2022/23[3] and a dividend policy with a pay-out ratio between 25% and 35%.
Furthermore, Alstom will conduct a disciplined investment and external growth transactions policy to support its development and to create value.
[1] Including the share of net income of the joint venture with CASCO held by Alstom at 49%
[2] Net profit from continuing operations attributable to equity holders of the parent
[3] The free cash flow generation is subject to usual short-term volatility linked to customers down payments and milestone payments from customers
***
Appendix 1a – Geographic Breakdown
This press release contains forward-looking statements which are based on current plans and forecasts of Alstom’s management. Such forward-looking statements are relevant to the current scope of activity and are by their nature subject to a number of important risks and uncertainty factors (such as those described in the documents filed by Alstom with the French AMF) that could cause actual results to differ from the plans, objectives and expectations expressed in such forward-looking statements. These such forward-looking statements speak only as of the date on which they are made, and Alstom undertakes no obligation to update or revise any of them, whether as a result of new information, future events or otherwise.
|
Actual figures |
2018/19 |
% |
2019/20 |
% |
|
(in € million) |
Q1 |
Contrib. |
Q1 |
Contrib. |
|
Europe |
830 |
32% |
1,331 |
83% |
|
Americas |
1,477 |
56% |
100 |
6% |
|
Asia / Pacific |
302 |
11% |
165 |
10% |
|
Middle East / Africa |
32 |
1% |
24 |
1% |
|
Orders by destination |
2,641 |
100% |
1,620 |
100% |
|
Actual figures |
2018/19 |
% |
2019/20 |
% |
|
(in € million) |
Q1 |
Contrib. |
Q1 |
Contrib. |
|
Europe |
1,040 |
52% |
1,154 |
55% |
|
Americas |
363 |
18% |
298 |
15% |
|
Asia / Pacific |
230 |
11% |
238 |
12% |
|
Middle East / Africa |
384 |
19% |
364 |
18% |
|
Sales by destination |
2,017 |
100% |
2,054 |
100% |
Appendix 1b – Product Breakdown
|
Actual figures |
2018/19 |
% |
2019/20 |
% |
|
(in € million) |
Q1 |
Contrib. |
Q1 |
Contrib. |
|
Rolling stock |
453 |
17% |
984 |
61% |
|
Services |
966 |
36% |
324 |
20% |
|
Systems |
837 |
32% |
33 |
2% |
|
Signalling |
385 |
15% |
279 |
17% |
|
Orders by destination |
2,641 |
100% |
1,620 |
100% |
|
Actual figures |
2018/19 |
% |
2019/20 |
% |
|
(in € million) |
Q1 |
Contrib. |
Q1 |
Contrib. |
|
Rolling stock |
888 |
44% |
967 |
47% |
|
Services |
380 |
19% |
358 |
18% |
|
Systems |
425 |
21% |
375 |
18% |
|
Signalling |
324 |
16% |
354 |
17% |
|
Sales by destination |
2,017 |
100% |
2,054 |
100% |
Appendix 2 - Non-GAAP financial indicators definitions
This section presents financial indicators used by the Group that are not defined by accounting standard setters
Orders received
A new order is recognised as an order received only when the contract creates enforceable obligations between the Group and its customer.
When this condition is met, the order is recognised at the contract value.
If the contract is denominated in a currency other than the functional currency of the reporting unit, the Group requires the immediate elimination of currency exposure through the use of forward currency sales. Orders are then measured using the spot rate at inception of hedging instruments.
Order backlog
Order backlog represents sales not yet recognised on orders already received.
Order backlog at the end of a financial year is computed as follows:
- order backlog at the beginning of the year;
- plus new orders received during the year;
- less cancellations of orders recorded during the year;
- less sales recognised during the year.
Order backlog corresponds to the transaction price allocated to the remaining performance obligations, as per IFRS15 standard quantitative and qualitative disclosures requirements.
Book-to-Bill
The book-to-bill ratio is the ratio of orders received to the amount of sales traded for a specific period.
Adjusted EBIT
When Alstom’s new organisation was implemented in 2015, adjusted EBIT (“aEBIT”) became the Key Performance Indicator to present the level of recurring operational performance. This indicator is also aligned with market practice and comparable to direct competitors.
Going forward (1st application for Half Year 2019/2020 publication), Alstom has opted for the inclusion of the share in net income of the equity-accounted investments into the aEBIT when these are considered as part of the operating activities of the Group (because there are significant operational flows and/or common project execution with these entities), namely the CASCO Joint Venture. The company believes that bringing visibility over a key contributor to the Alstom signalling strategy will provide a fairer and more accurate picture of the overall commercial & operational performance of the Group. This change will also enable more comparability with what similar market players define as being part of their main non-GAAP ‘profit’ aggregate disclosure.
aEBIT corresponds to Earning Before Interests and Tax adjusted for the following elements:
- net restructuring expenses (including rationalization costs);
- tangibles and intangibles impairment;
- capital gains or loss/revaluation on investments disposals or controls changes of an entity;
- any other non-recurring items, such as some costs incurred to realize business combinations and amortisation of an asset exclusively valued in the context of business combination as well as litigation costs that have arisen outside the ordinary course of business;
- and including the share in net income of the operational equity-accounted investments.
A non-recurring item is a “one-off” exceptional item that is not supposed to occur again in following years and that is significant.
Adjusted EBIT margin corresponds to Adjusted EBIT in percentage of sales.
Free cash flow
Free cash flow is defined as net cash provided by operating activities less capital expenditures including capitalised development costs, net of proceeds from disposals of tangible and intangible assets. In particular, free cash flow does not include the proceeds from disposals of activity.
The most directly comparable financial measure to free cash flow calculated and presented in accordance with IFRS is net cash provided by operating activities.
Alstom uses the free cash flow both for internal analysis purposes as well as for external communication as the Group believes it provides accurate insight regarding the actual amount of cash generated or used by operations.
Net cash/(debt)
The net cash/(debt) is defined as cash and cash equivalents, other current financial assets and non-current financial assets directly associated to liabilities included in financial debt, less financial debt.
Pay-out ratio
The pay-out ratio is calculated by dividing the amount of the overall dividend with the "Net profit from continuing operations attributable to equity holders of the parent” as presented in the consolidated income statement.
Organic basis
Figures given on an organic basis eliminate the impact of changes in scope of consolidation and changes resulting from the translation of the accounts into Euro following the variation of foreign currencies against the Euro. The Group uses figures prepared on an organic basis both for internal analysis and for external communication, as it believes they provide means to analyse and explain variations from one period to another. However, these figures are not measurements of performance under IFRS.
|
Q1 2018/19 |
Q1 2019/20 |
|
|
|
|||||||
|
(in € million) |
Actual |
Exchange |
Scope |
Comparable |
Actual |
Scope |
Comparable |
% Var Act. |
% Var Org. |
||
|
Orders |
2,641 |
33 |
- |
2,675 |
|
1,620 |
|
1,620 |
|
(39)% |
(39)% |
|
Sales |
2,017 |
26 |
- |
2,043 |
|
2,054 |
|
2,054 |
|
2% |
1% |